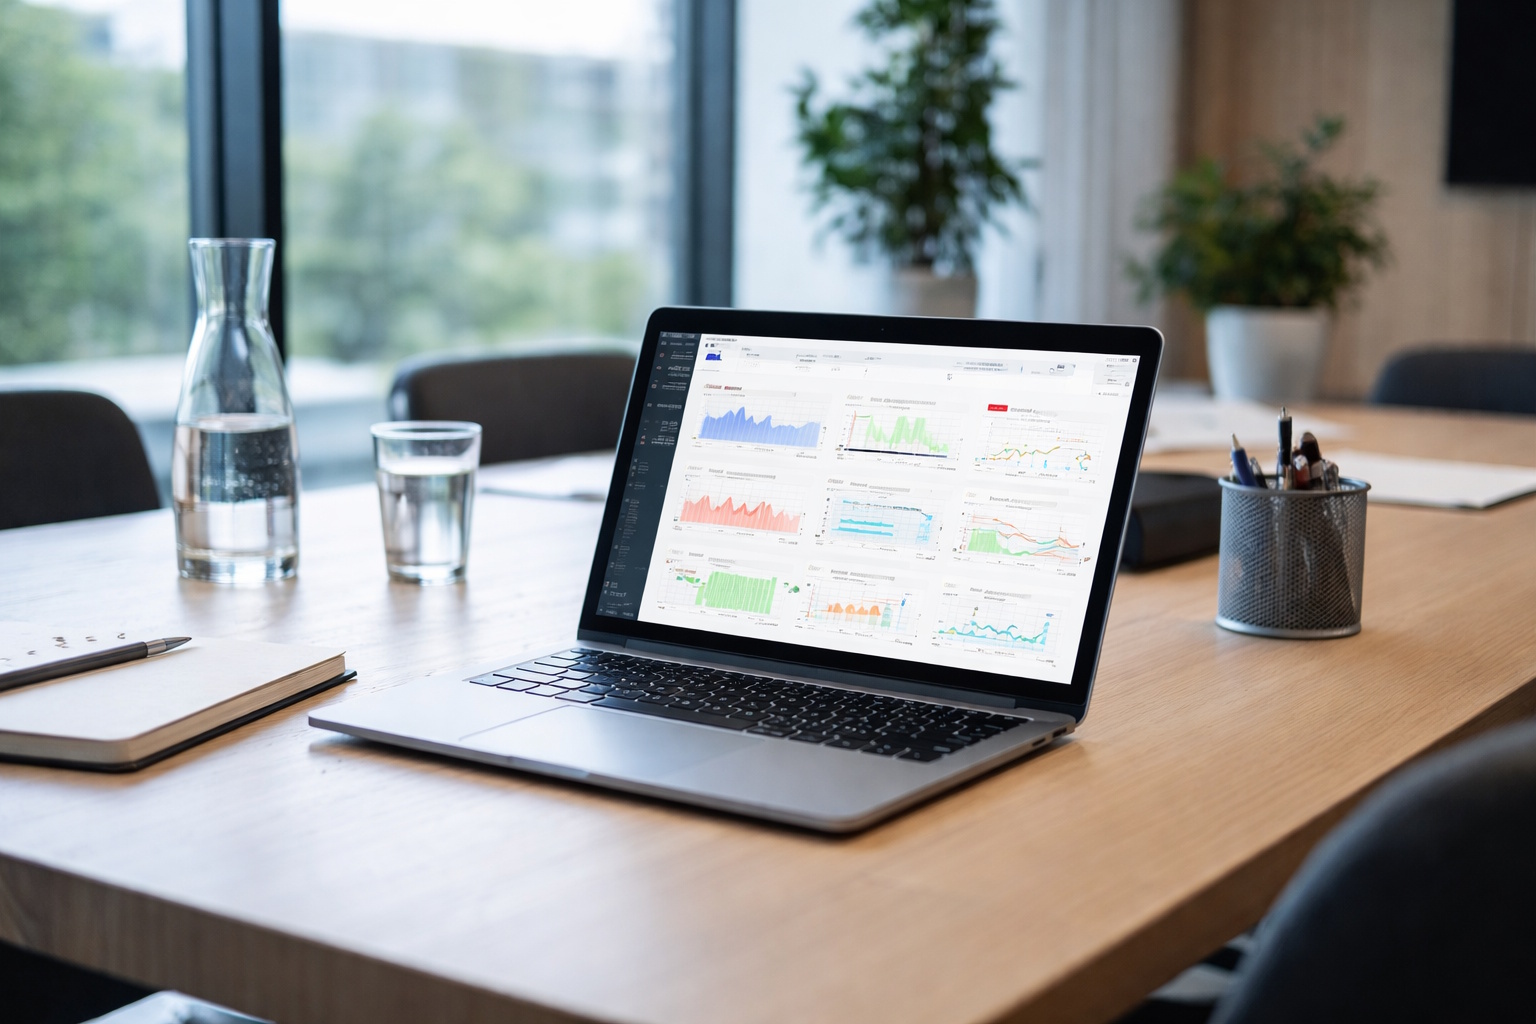
Analytics Dashboard
Get full overview of all your sensors and data in one central dashboard. Analyze trends, generate reports and make better decisions based on actual data.
All insights in one place
Our analytics dashboard collects data from all sensors and systems in one clear platform. See real-time data, analyze history and share insights with colleagues.
Unified view
All sensors and data sources collected in one dashboard, regardless of type or location.
Real-time data
See live updates from all sensors with minimal delay.
Customizable views
Create your own dashboards with the widgets and data that matter most to you.
Automated reports
Set up scheduled reports sent to key personnel via email.
Data export
Export data in various formats for further analysis or integration.
Mobile access
Access the dashboard from mobile and tablet, anywhere.
How to use the dashboard
From data to insights — an intuitive experience.
Data collection
Sensors and systems continuously send data to the platform.
Visualization
Data is presented in graphs, maps and widgets adapted to your needs.
Analysis
Explore trends, compare periods and identify patterns.
Action
Make informed decisions based on actual data and insights.
Who uses the analytics dashboard?
The dashboard provides value for different roles and use cases.
Management
High-level overview of operations and key metrics across locations.
Operations staff
Detailed insight into technical systems and alerts on deviations.
Chain operations
Comparison of performance between stores and regions.
Property management
Monitoring of multiple buildings from one central point.
Sustainability
Tracking of energy consumption and environmental data for reporting.
Quality and compliance
Documentation and reports for audits and certification.
Benefits of analytics dashboard
Centralized insights enable better decisions.
- Full overview of all systems and data
- Better decisions based on facts
- Save time with automated reports
- Share insights easily with colleagues
- Identify trends and patterns
- Access anytime, anywhere
Integrated with Insight Portal
All our sensors and services connect to our in-house developed portal for easy access to data and analysis.
Frequently asked questions
Find answers to the most common questions about this service.
Yes, you can create your own views, choose widgets and determine which data is displayed.
Standard is 2 years of history, but this can be extended as needed.
Yes, you can create multiple users with different permissions and access levels.
Yes, we offer API for integration with BMS, ERP systems and other platforms.
Yes, all communication is encrypted and data is stored securely in accordance with GDPR.
Ready for better overview?
Contact us to see how the dashboard can provide value for your business.